Introduction
In order to survive and reproduce, all living organisms must adjust to conditions imposed on them by their environments. An organism’s environment includes everything that surrounds them as well as their food sources and predators. Species of plants and animals that live in a particular environment have members with advantages based on differing genes. The members of the population with advantages will be more likely to successfully mate and reproduce, as well as survive. Over time and many generations this will lead to evolution because the gene pool will shift to a majority of members with the advantageous genes. In this way the environment plays a crucial role in the evolution of species. The environment has biotic factors which are living factors that affect organisms as well as abiotic factors which are non-living factors that affect organisms. These factors also greatly influence the species that live within particular environments. In this lab we visited a nature reserve and accounted for the amount and varying plant species within the pond environment. We also considered the biotic and abiotic factors in this environment and considered how they might influence the inhabitants.
Hypothesis
Due to abiotic factors, including the presence of methane and other gases and salinity of the soil, we hypothesized that there would be more plants and diversity further away from the pond and less diversity closer to the pond.
Materials and Methods
Materials
Transects (quadrats)
Tape measurer (optional)
Data book
Method
1) First we randomly selected two areas to conduct our transect study. We made sure that the area we chose was within a 100 square meter area (10m x 10m).
2) Next we described the location of our site considering biotic and abiotic factors. We wanted to describe the area accurately so other people could find it and compare their findings to our results. We also took pictures of each quadrant and observed the abiotic factors, such as whether there was light or shade and dry or moist soil. We then recorded our observations.
3) Next we took an inventory of the different kinds of plants found on our site.
4) Then we recorded the number of species of plants that were within each quadrant.
5) We repeated steps 3 and 4 twice more to obtain data for two other quadrants within the site.
6) Next we reviewed our count of species, added up the number of organisms found in all three quadrants and divided by four to calculate the average population density per square meter. Then we recorded the average population densities in our data book.
7) Finally, for each species, we multiplied the population density by the total size or area surveyed to estimate the total number of plants in the larger site. Then we recorded the estimated population size in our data books.
Data / Results
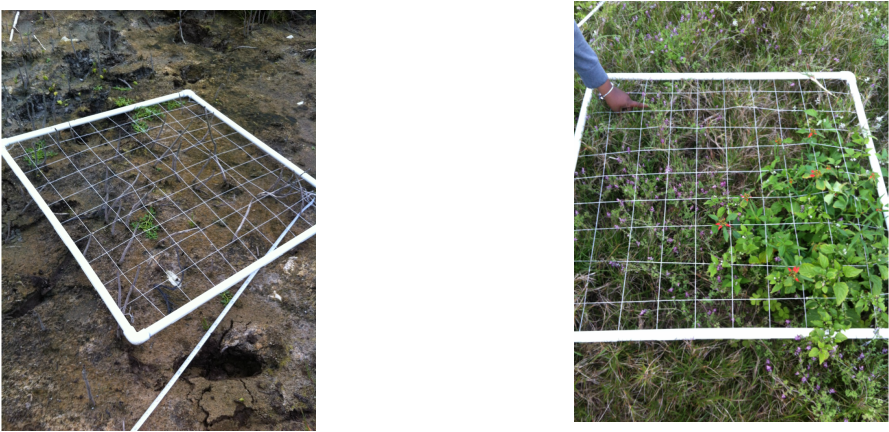
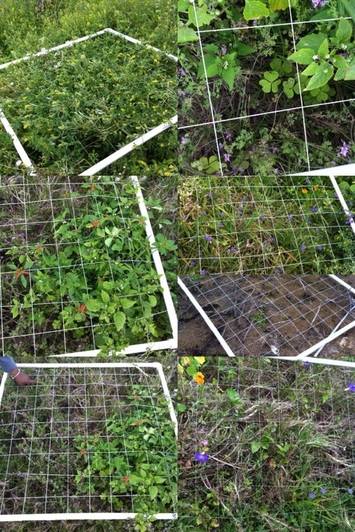
Quadrant 1, 2, & 3 are results from the first pond, while quadrand 4, 5, & 6 are from the second pond.
Quadrant 1 Quadrant 2
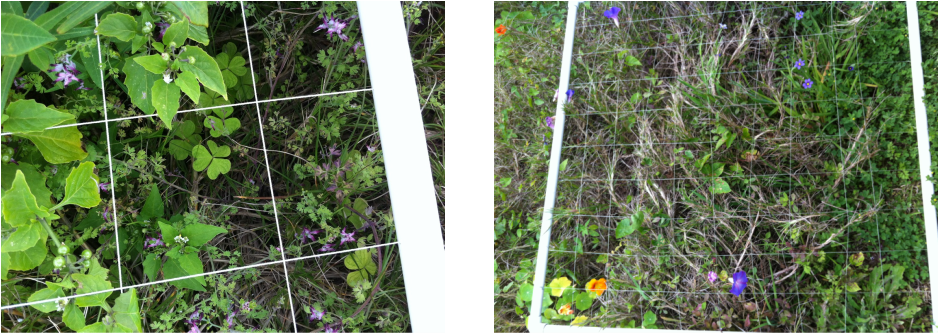
Quadrant 3 Quadrant 4
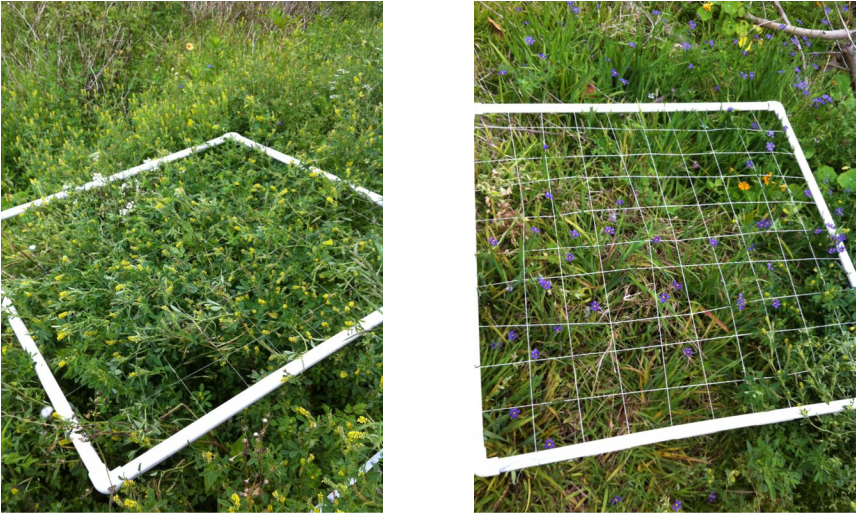
Quadrant 5 Quadrant 6
Disscusion
When conducting our research of the species within a pond environment we used four quadrants to estimate species populations. At pond number one in our first quadrant, which was eight meters from the pond's edge, we found that about 40% were species of plants and 60% was mud. Within this space we accounted for two species which were a black mangrove tree and a little sea parcel. At 16-24 meters from the pond there was only grass (possibly crab grass) and no other species. We did not get a picture of this quadrant but the grass we are referring to is the same grass found in the other quadrant pictures from the first pond. When we were about 32 meters away from the pond we started to see more species of plants. We found four species; grass, clovers, and two distinct flowers. One species of flower made up about 32% of the quadrant and was purple and white. The other species of flowers also made up 32% of the quadrant and was completely red. The rest of the quadrant was the tall grass 32% and the clovers, 4%. Finally, at a distance of 36 meters from the pond we also found the same four species as in quadrant three at about the same ratio.
In pond number two our species findings were quite different. Our first quadrant was at 12 meters from the pond's edge and was composed only of grass. The entire area up to sixteen meters from the pond only had one species of grass. This was probably the same type of grass that was found around pond number one. At our second quadrant, which was at 18 meters from the pond, we found two species of plants. The first was a yellow flower, which made up 90% of the quadrant, and the second was a white flower possibly called Baby Breath, which made up the remaining 10% of the quadrant. In our third quadrant, which was 24 meters from the pond, we found Bermudianas, 4% of the quadrant, some orange flowers called Nasturtiums, 6% of the quadrant, some Blue Bell flowers, 8% of the quadrant, scrubs, making up 16%, and grass, the remaining 66%. Finally in our fourth quadrant which was 32 meters from the pond, we found 6 different species. These species included Bermudianas, 37%, yellow flowers, 10%, brunt red scrubs, 6%, Nasturtiums, 3%, grass, 40% and burnt purple flowers 4%.
We could not calculate the average population density because we chose to do our quadrants along a line. Instead, we used a systematic sampling method by taking a quadrant sample every few meters moving away from the pond in a straight line. Therefore, we do not think that the average population density would properly represent the area we observed along a straight line.
Conclusion
In the end, our hypothesis was correct. The further we moved from the pond, the more diversity there was. If we were to do this experiment again, we would definitely make sure that we cover a particular area so that we can determine the average population densities. Then with that information we could try to estimate the total number of organisms in the larger site. We learned that it is necessary to select random spots to conduct transects
to avoid unrepresentative samples and human error. By doing our quadrants every
so many meters, we were able to rule out any bias or human error. On the other hand, perhaps we focused too closely on this because it ruined our results for the population densities. One thing we can say is that the dominant plant
species within both sites was the grass. However, we did not find the same species of grass in both sites. For example, we did not find Bermudianas or Nasturtium in the first pond, however we found them in the second pond. Also, the sampling of animal populations are more difficult than that of plant populations because animals can move. We can however predict that there would have been less animal species near the pond due to high pH levels, salt, and other abiotic factors.
